
GCSE Physics (AQA)
346 videos | 23 hours
Please subscribe to watch this video.
This, and all other videos, are included in our premium subscriptions.
Premium accounts get access to all videos.
Enable autoplay to keep watching
Your browser is blocking videos from playing automatically. To turn it back on:
Safari (Mac): Click the Safari menu item in the top bar, then Settings → Websites → Auto-Play, then set Auto-Play to Allow All Auto-Play for the current website.
Safari (iPhone/iPad): open the Settings app, then Apps → Safari → Auto-Play, and select Allow All Auto-Play.
Particle model of matter
Internal energy and energy transfers
Cooling Graphs
2:07
Heating to Change State
Spec
4.3.2.3
- The rate at which an object cools changes with its temperature.
- Temperature changes over time can be represented on a graph.
- Initially, the temperature drops quickly, then slows down as heat flow to the surroundings decreases when temperatures become closer.
- During exams, detailed understanding of this process is not required.
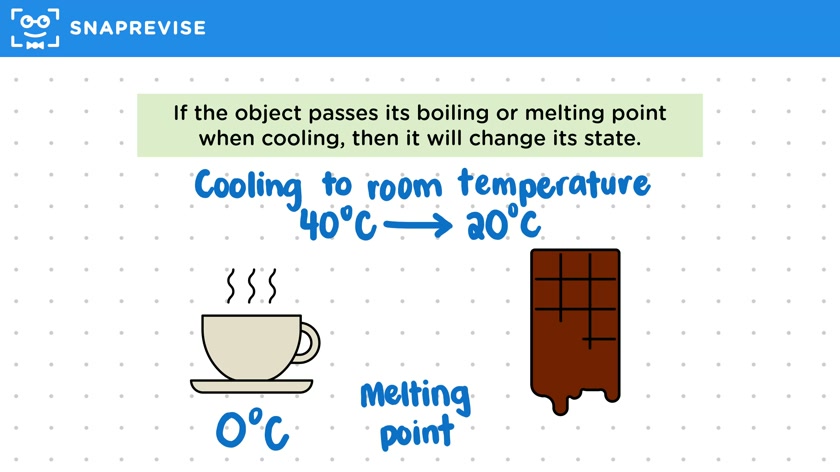
- An object changes state if it passes its boiling or melting point when cooling.
- Example: Hot tea and melted chocolate cooling to room temperature from around 40��C to 20��C.
- Tea remains liquid as its temperature doesn't drop below its melting point (0��C).
- Chocolate becomes solid as its temperature drops below its melting point (30��C).
- During a change of state, the temperature remains constant for a period.
- On a cooling graph, the gradient changes and there is a horizontal section indicating the freezing point.
- No kinetic energy is lost during the horizontal section; bonds form instead.
- The graph's gradient changes again after the change of state, similar to the initial cooling phase.
- Heat flow to the surroundings slows as temperatures become closer.
- Cooling graphs have smooth transitions between sections, unlike heating graphs.
Please subscribe to access these revision notes.
This, and all other video notes, are included in our premium subscriptions.
Premium accounts get access to all videos and revision notes.
Report an Issue
Spotted something wrong? Let us know and we'll take a look.