
GCSE Maths (AQA)
435 videos | 33 hours
Please subscribe to watch this video.
This, and all other videos, are included in our premium subscriptions.
Premium accounts get access to all videos.
Enable autoplay to keep watching
Your browser is blocking videos from playing automatically. To turn it back on:
Safari (Mac): Click the Safari menu item in the top bar, then Settings → Websites → Auto-Play, then set Auto-Play to Allow All Auto-Play for the current website.
Safari (iPhone/iPad): open the Settings app, then Apps → Safari → Auto-Play, and select Allow All Auto-Play.
Probability
Probability
Venn Diagrams
6:26
Venn Diagrams
Spec
P6
- Venn diagrams are used to sort values from a universal set into two other sets
- Sets can follow a specific rule or be random
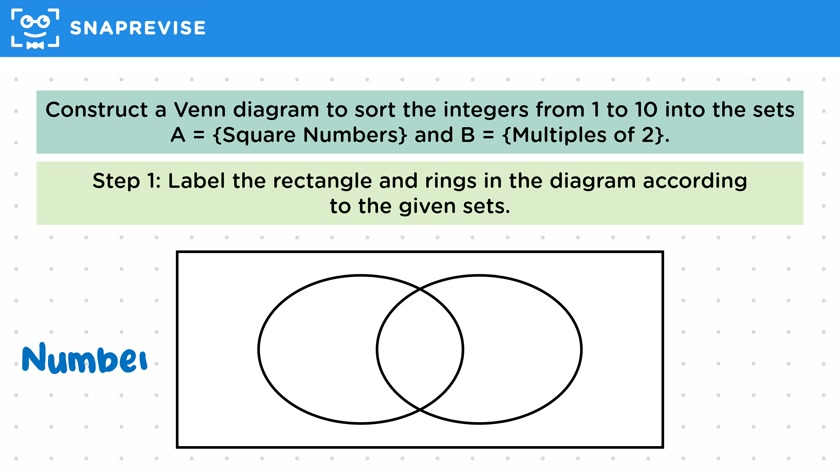
- Rings in the Venn diagram represent sets with values placed in them
- The intersection of two sets is denoted by a stylized N symbol and contains values that are in both sets
- The union of two sets is denoted by a stylized U symbol and contains all values in either set
- The rectangle represents the universal set, providing context for the sets
- Values not in the given sets are placed outside the rings
- Examples of Venn diagrams are given for sorting integers into sets of square numbers and multiples of 2
- Venn diagrams can be used to answer questions about sets, such as identifying employees who have not stolen stationery or who have stolen stationery but not refreshments.
Please subscribe to access these revision notes.
This, and all other video notes, are included in our premium subscriptions.
Premium accounts get access to all videos and revision notes.
Report an Issue
Spotted something wrong? Let us know and we'll take a look.