
GCSE Combined Science (AQA)
622 videos | 38 hours
Please subscribe to watch this video.
This, and all other videos, are included in our premium subscriptions.
Premium accounts get access to all videos.
Enable autoplay to keep watching
Your browser is blocking videos from playing automatically. To turn it back on:
Safari (Mac): Click the Safari menu item in the top bar, then Settings → Websites → Auto-Play, then set Auto-Play to Allow All Auto-Play for the current website.
Safari (iPhone/iPad): open the Settings app, then Apps → Safari → Auto-Play, and select Allow All Auto-Play.
Particle model of matter
Internal energy and energy transfers
Heating Graphs
2:20
Heating to Change State
Spec
4.3.2.3
- Heat supplied to an object at a constant rate causes its temperature to rise gradually.
- A graph can represent how temperature changes over time.
- Initially, temperature rises at a constant rate due to constant heat supply.
- The gradient of the graph is determined by specific heat capacity.
- At the melting point, temperature remains constant during the change of state despite constant heat supply.
- The graph shows a horizontal section at the melting point due to no temperature change.
- Energy is used for changing the state, not increasing kinetic energy or temperature.
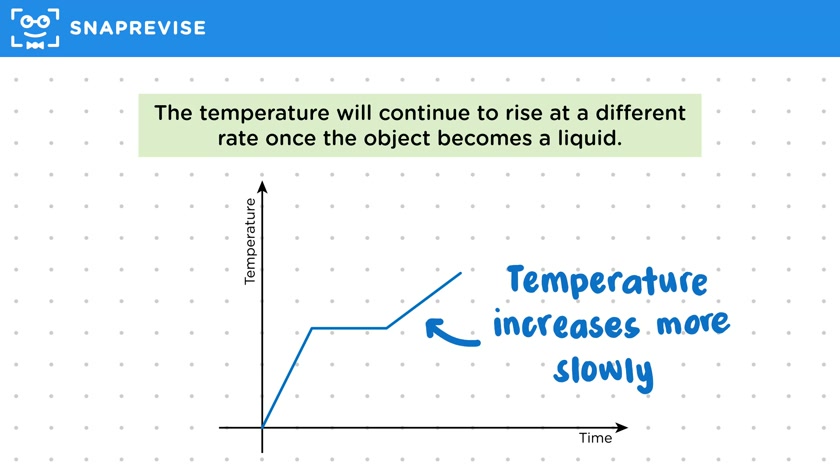
- Temperature rises at a different rate once the object becomes a liquid, with a new specific heat capacity.
- Temperature stops increasing again at the boiling point, indicating another change of state.
- The graph is horizontal at the boiling point as energy is used for the state change.
- Different lengths of horizontal sections indicate different latent heats.
- Temperature rises again once the object becomes a gas, with another new specific heat capacity.
- The graph can continue indefinitely for gases.
- The graph is specific to water, but other substances have similar shapes with different gradients and boiling/melting points.
- Understanding and explaining such graphs may be required in exams.
Please subscribe to access these revision notes.
This, and all other video notes, are included in our premium subscriptions.
Premium accounts get access to all videos and revision notes.
Report an Issue
Spotted something wrong? Let us know and we'll take a look.