
GCSE Biology (AQA)
331 videos | 14 hours
Please subscribe to watch this video.
This, and all other videos, are included in our premium subscriptions.
Premium accounts get access to all videos.
Enable autoplay to keep watching
Your browser is blocking videos from playing automatically. To turn it back on:
Safari (Mac): Click the Safari menu item in the top bar, then Settings → Websites → Auto-Play, then set Auto-Play to Allow All Auto-Play for the current website.
Safari (iPhone/iPad): open the Settings app, then Apps → Safari → Auto-Play, and select Allow All Auto-Play.
Homeostasis and Response
The Human Nervous System
Reaction Times Data
4:57
Reflexes and Reaction Times
Spec
4.5.2.1
- Three students set up an experiment to compare their reaction times using a computer program.
- The experiment involved sitting in front of a white computer screen and clicking the mouse when the screen turned red.
- The experiment was repeated three more times for accuracy.
- Results were recorded in a table showing reaction times in milliseconds for each trial.
- Reaction time is defined as the time between the screen changing color and the student's response.
- To simplify data comparison, a mean reaction time for each student was calculated and added to the table.
- Anomalies in the data, likely caused by errors, were identified and excluded from mean calculations.
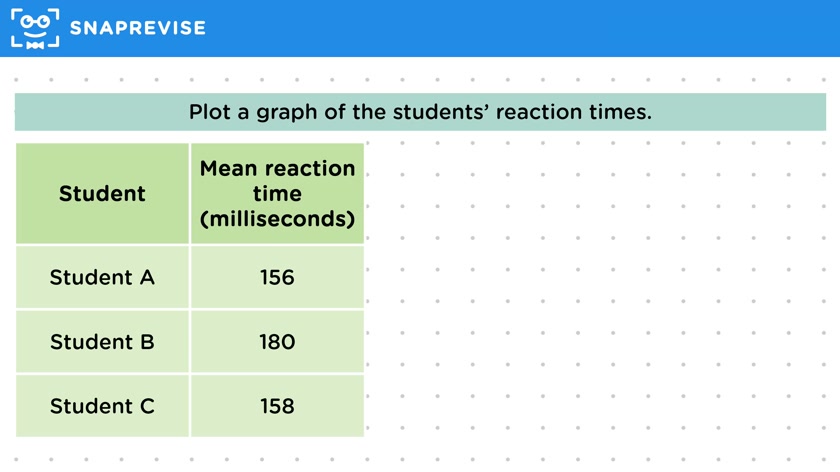
- Mean reaction times calculated: Student A - 156 ms, Student B - 180 ms, Student C - 158 ms.
- A bar chart was chosen to graphically represent the data because students are a categorical variable.
- The Y-axis was labeled with reaction times in milliseconds, and the X-axis labeled with student identifiers (A, B, C).
- A scale was established on the Y-axis with intervals of 10 milliseconds, up to a maximum of 200 milliseconds.
- Bars representing each student's mean reaction time were plotted on the graph.
- The graph was used to interpret the data, showing that Student B had the slowest reaction time, while the difference between Students A and C was insignificant.
Please subscribe to access these revision notes.
This, and all other video notes, are included in our premium subscriptions.
Premium accounts get access to all videos and revision notes.
Report an Issue
Spotted something wrong? Let us know and we'll take a look.