
GCSE Physics (AQA)
346 videos | 23 hours
Please subscribe to watch this video.
This, and all other videos, are included in our premium subscriptions.
Premium accounts get access to all videos.
Enable autoplay to keep watching
Your browser is blocking videos from playing automatically. To turn it back on:
Safari (Mac): Click the Safari menu item in the top bar, then Settings → Websites → Auto-Play, then set Auto-Play to Allow All Auto-Play for the current website.
Safari (iPhone/iPad): open the Settings app, then Apps → Safari → Auto-Play, and select Allow All Auto-Play.
Forces
Forces and elasticity
Force-Extension Graphs
2:10
Deformations and Springs
Spec
4.5.3
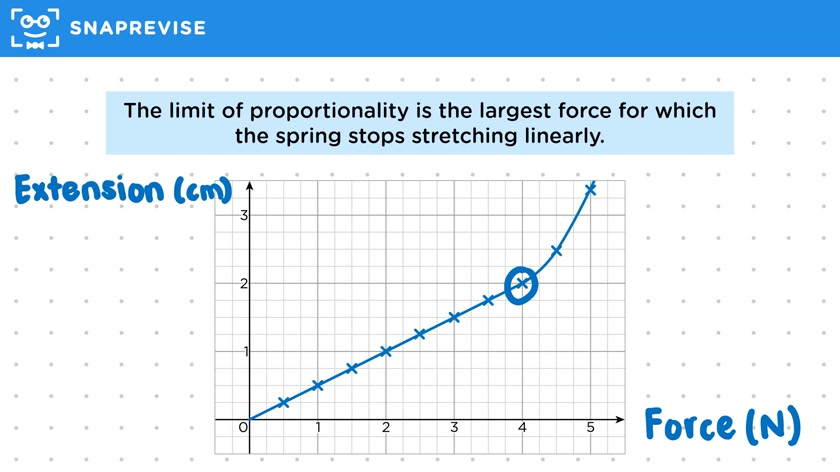
- A force extension graph shows the extension of a spring for certain applied forces.
- Extension is on the Y axis (centimeters), force is on the X axis (Newtons).
- Graphs are created by hanging known weights from the spring and measuring extension.
- Dots are joined with a smooth curve; the curve's shape changes.
- For small forces, the graph is linear (straight line, Y = MX + C).
- The limit of proportionality is the largest force for which the spring stretches linearly.
- After this point, the spring stretches more easily due to broken bonds.
- The limit of proportionality varies by material (e.g., small for elastic bands).
- Beyond this limit, the spring undergoes inelastic deformation.
- When force is removed, the spring remains permanently deformed with some extension.
- Some materials can still undergo elastic deformation after the limit (e.g., elastic bands), while others break shortly after (e.g., glass).
Please subscribe to access these revision notes.
This, and all other video notes, are included in our premium subscriptions.
Premium accounts get access to all videos and revision notes.
Report an Issue
Spotted something wrong? Let us know and we'll take a look.