
GCSE Combined Science (AQA)
622 videos | 38 hours
Please subscribe to watch this video.
This, and all other videos, are included in our premium subscriptions.
Premium accounts get access to all videos.
Enable autoplay to keep watching
Your browser is blocking videos from playing automatically. To turn it back on:
Safari (Mac): Click the Safari menu item in the top bar, then Settings → Websites → Auto-Play, then set Auto-Play to Allow All Auto-Play for the current website.
Safari (iPhone/iPad): open the Settings app, then Apps → Safari → Auto-Play, and select Allow All Auto-Play.
Waves
Waves in air, fluids and solids
Wave Diagrams & Amplitude
5:14
Properties of Waves
Spec
4.6.1.2
- A diagram can illustrate the shape of a transverse wave at a specific time.
- Transverse waves travel with matter vibrating up and down, perpendicular to energy transfer.
- Diagrams show the positions of matter at a certain point in time.
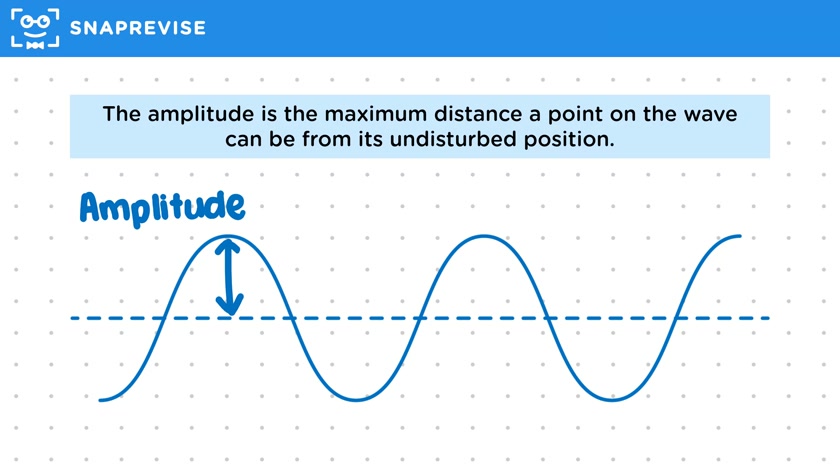
- The equilibrium line represents the position of matter before wave disturbances.
- Displacement measures how much matter has been displaced from the equilibrium line.
- Amplitude is the maximum distance a point on the wave can be from its undisturbed position.
- Peaks are points of maximum distance above the equilibrium line.
- Troughs are points of maximum distance below the equilibrium line.
- Amplitude is usually consistent throughout a wave but can decrease in some cases.
- At GCSE level, focus is on transverse waves and their diagrams.
- Peaks and troughs can be identified even if amplitude changes.
- Understanding diagrams and definitions is crucial for wave analysis.
- In real-world examples, such as ocean waves, key points and distances can be identified.
- Ocean waves are transverse waves with water moving up and down as energy travels along the surface.
- The equilibrium line in ocean waves represents the undisturbed water level.
- Displacement and amplitude can be measured by the distance from the equilibrium line.
- Peaks and troughs in ocean waves are where the water is at its highest or lowest points.
Please subscribe to access these revision notes.
This, and all other video notes, are included in our premium subscriptions.
Premium accounts get access to all videos and revision notes.
Report an Issue
Spotted something wrong? Let us know and we'll take a look.